Analytics on Second Sample
Images Stats
| Field | Value (voxels) |
|---|---|
| min | -1402 |
| max | 16195 |
| mean | 3860.706431 |
| std | 1968.235645 |
| size | 301301300 |
Slices
These are slices in the X-Y, Y-Z and X-Z planes
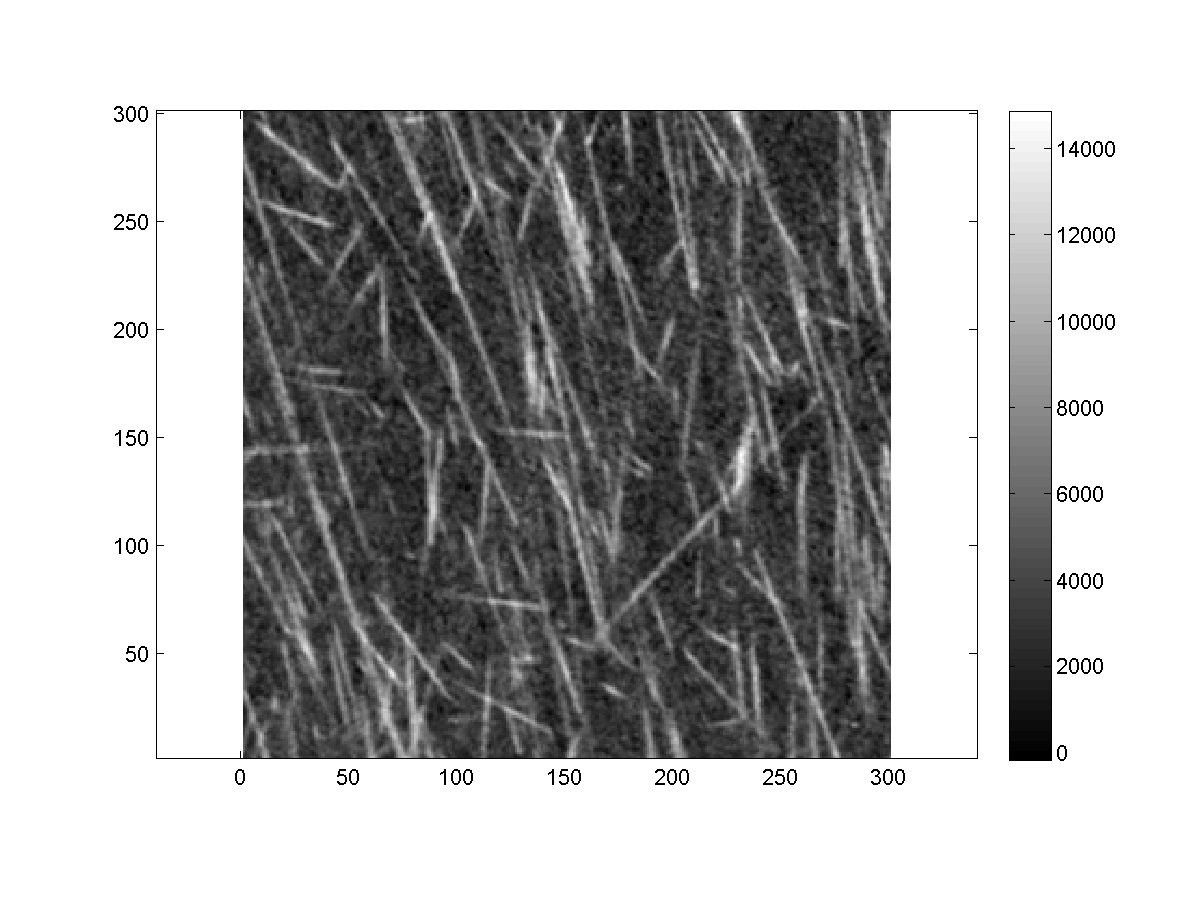
Top XY Slice of Sample Image
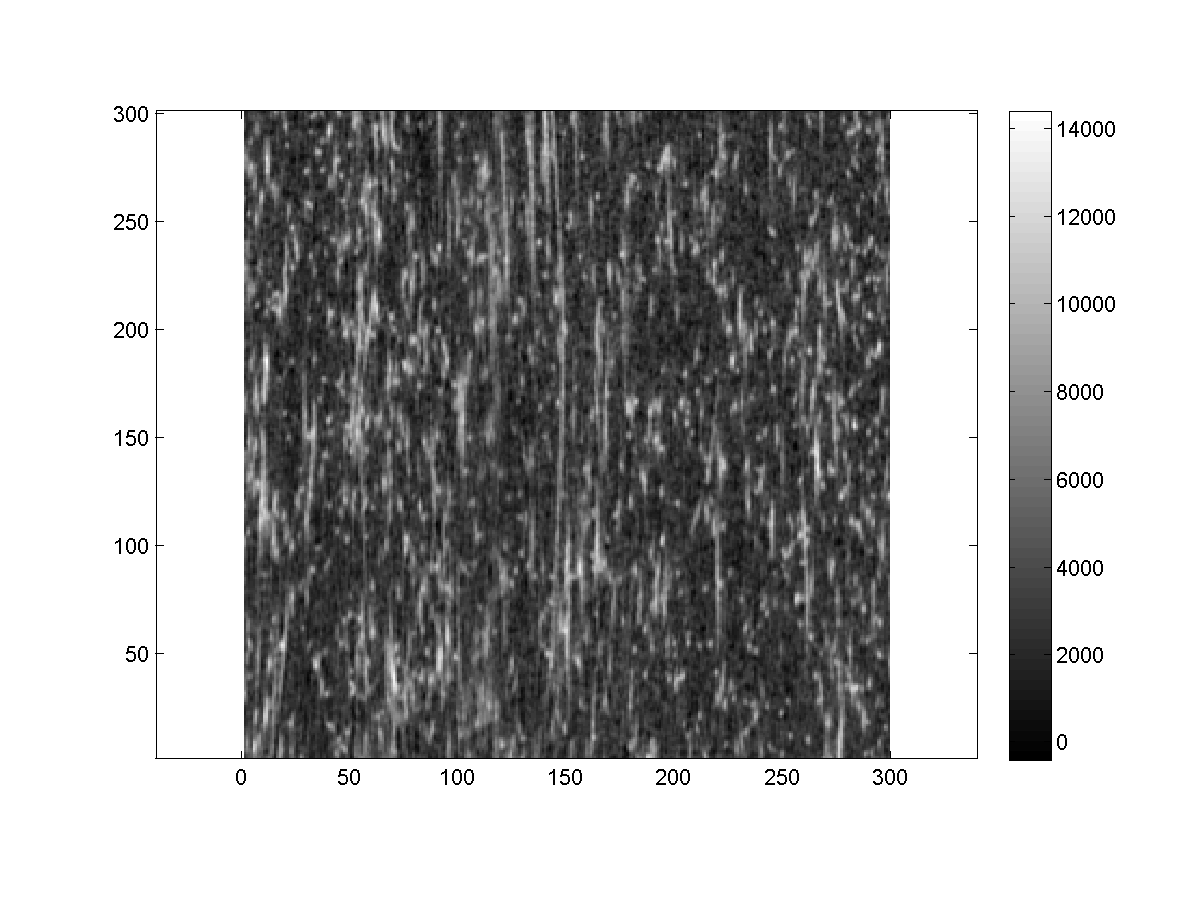
Top XZ Slice of Sample Image
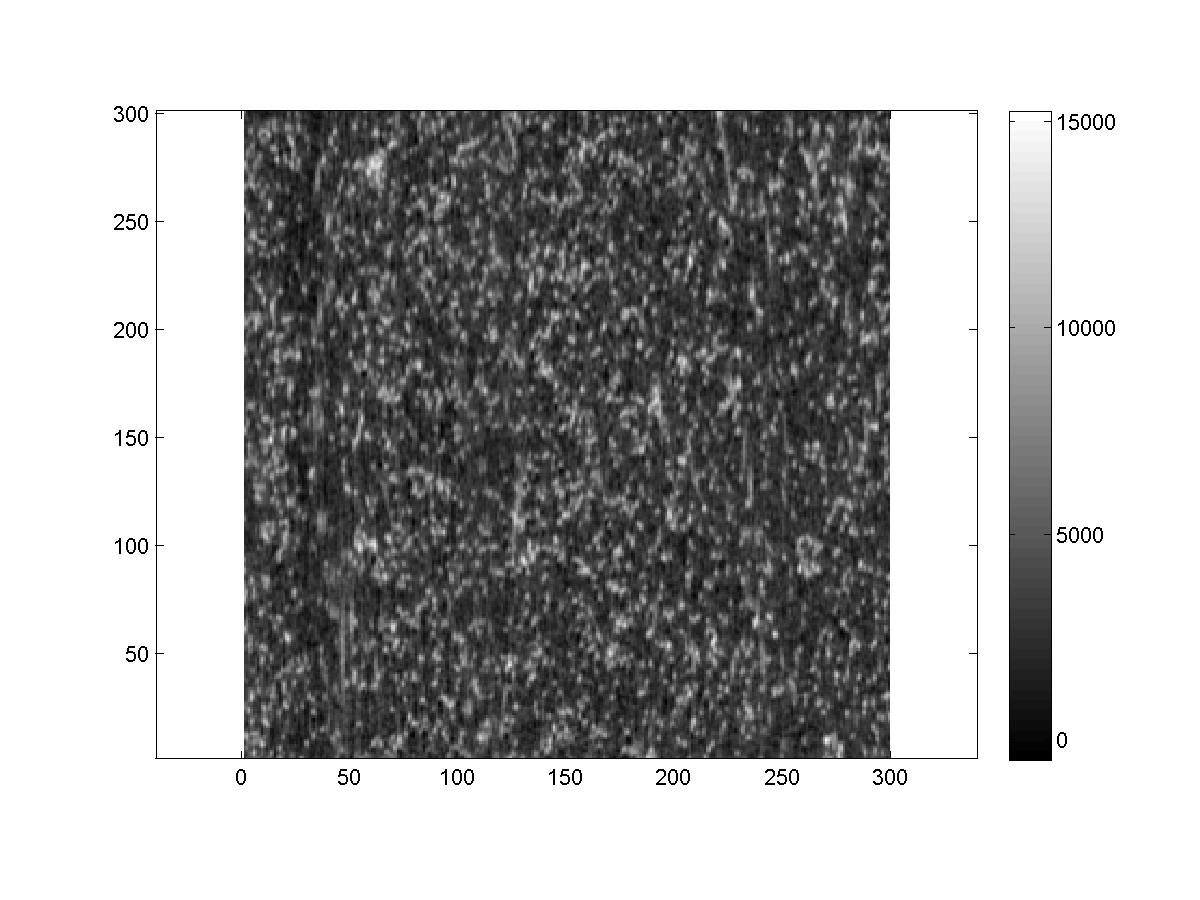
Top YZ Slice of Sample Image
Comparison of Distribution of Pixel Values
Distribution of Sample N
Distribution of Sample S
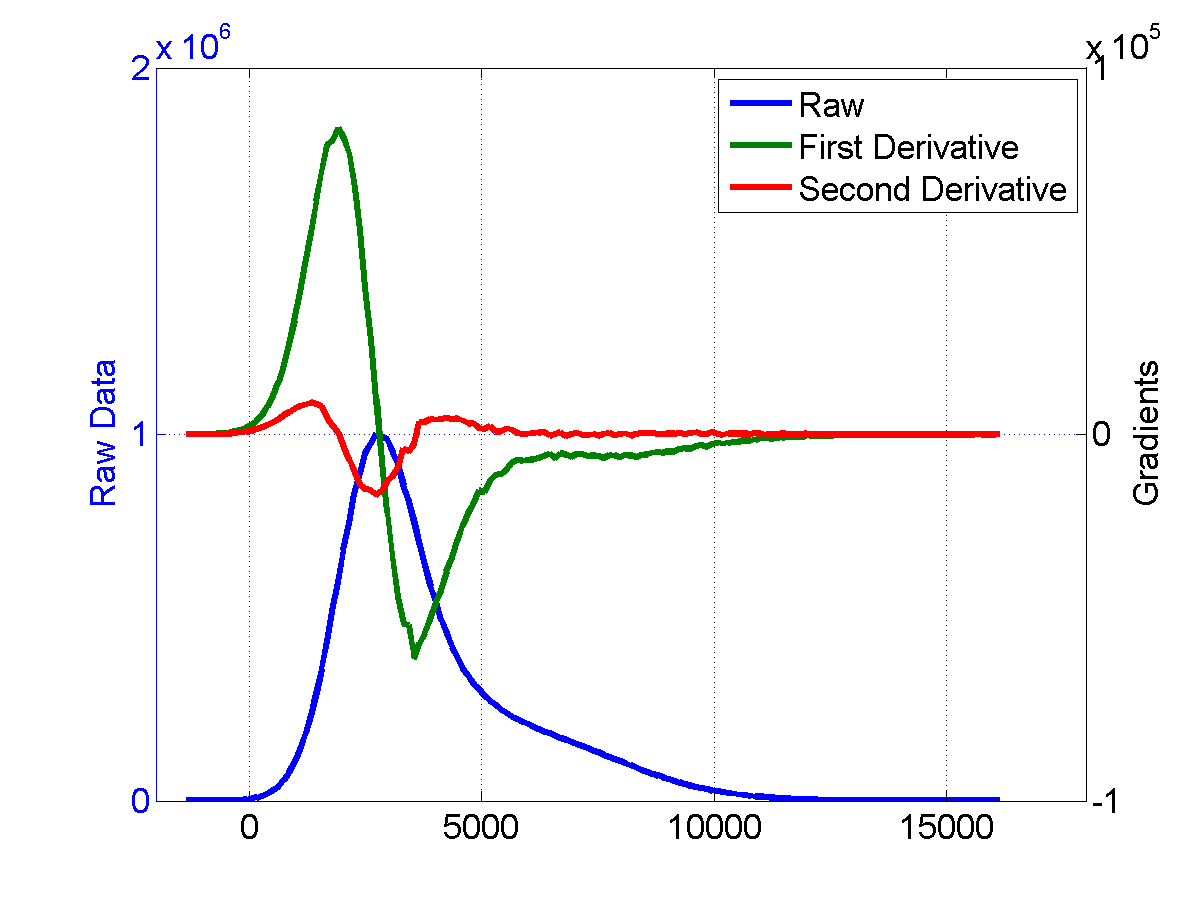
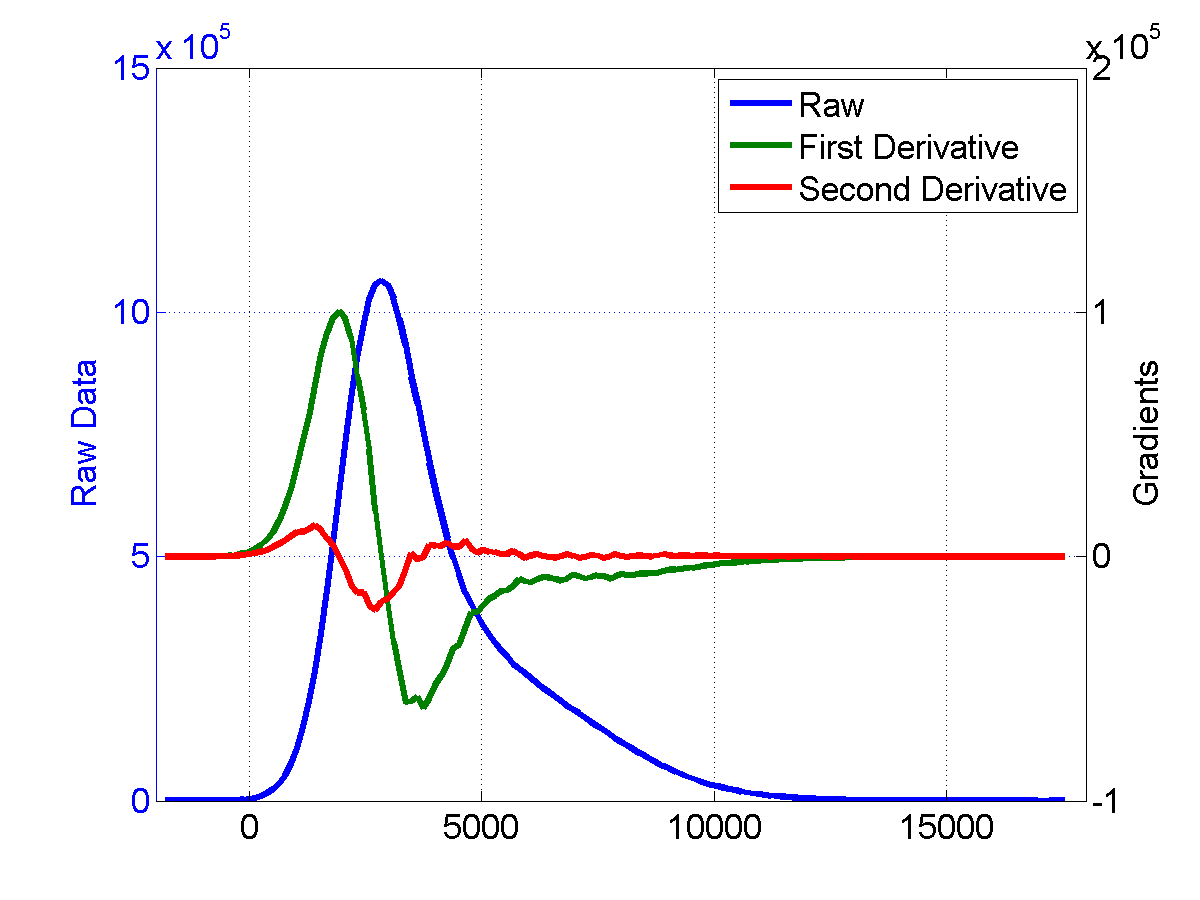
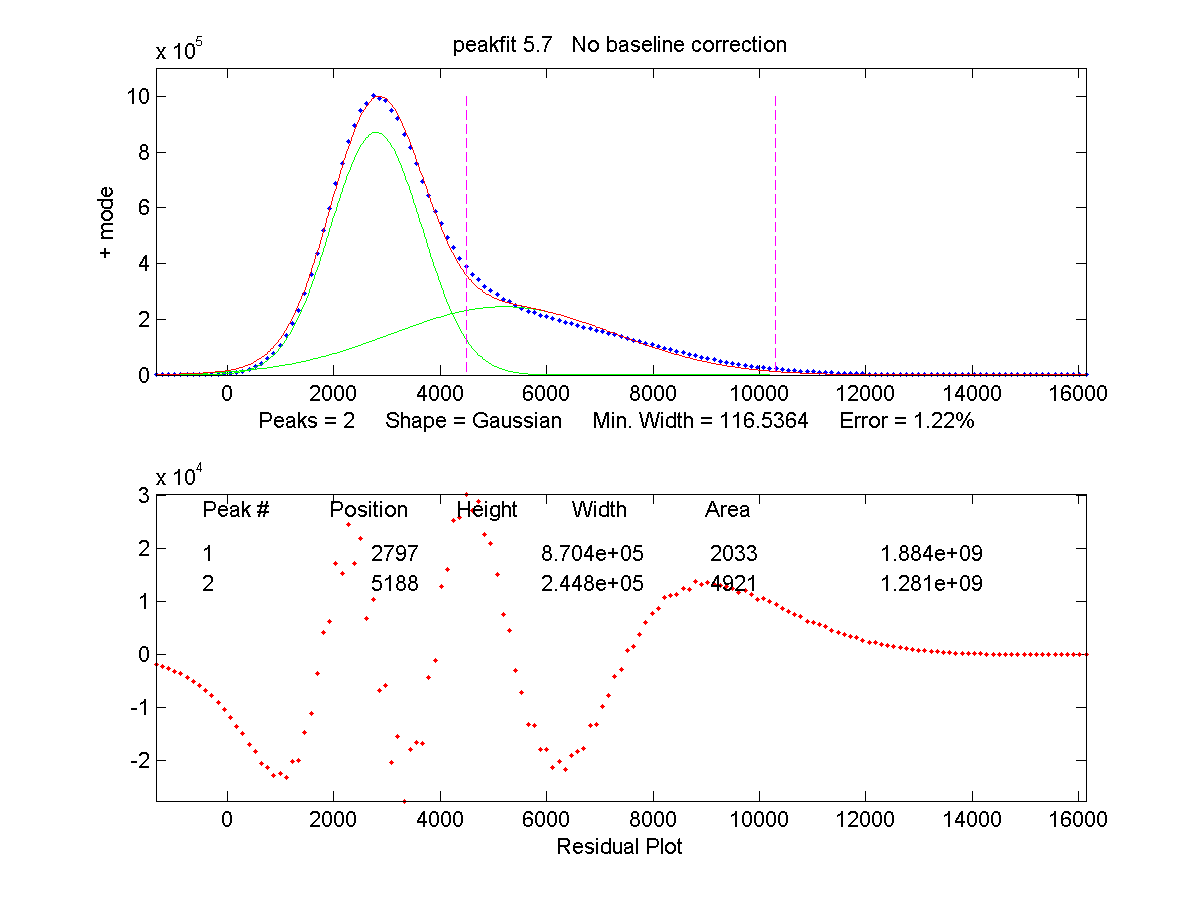
Peak fitting 2 peaks - Sample N
Peak fitting 3 peaks - a comparision
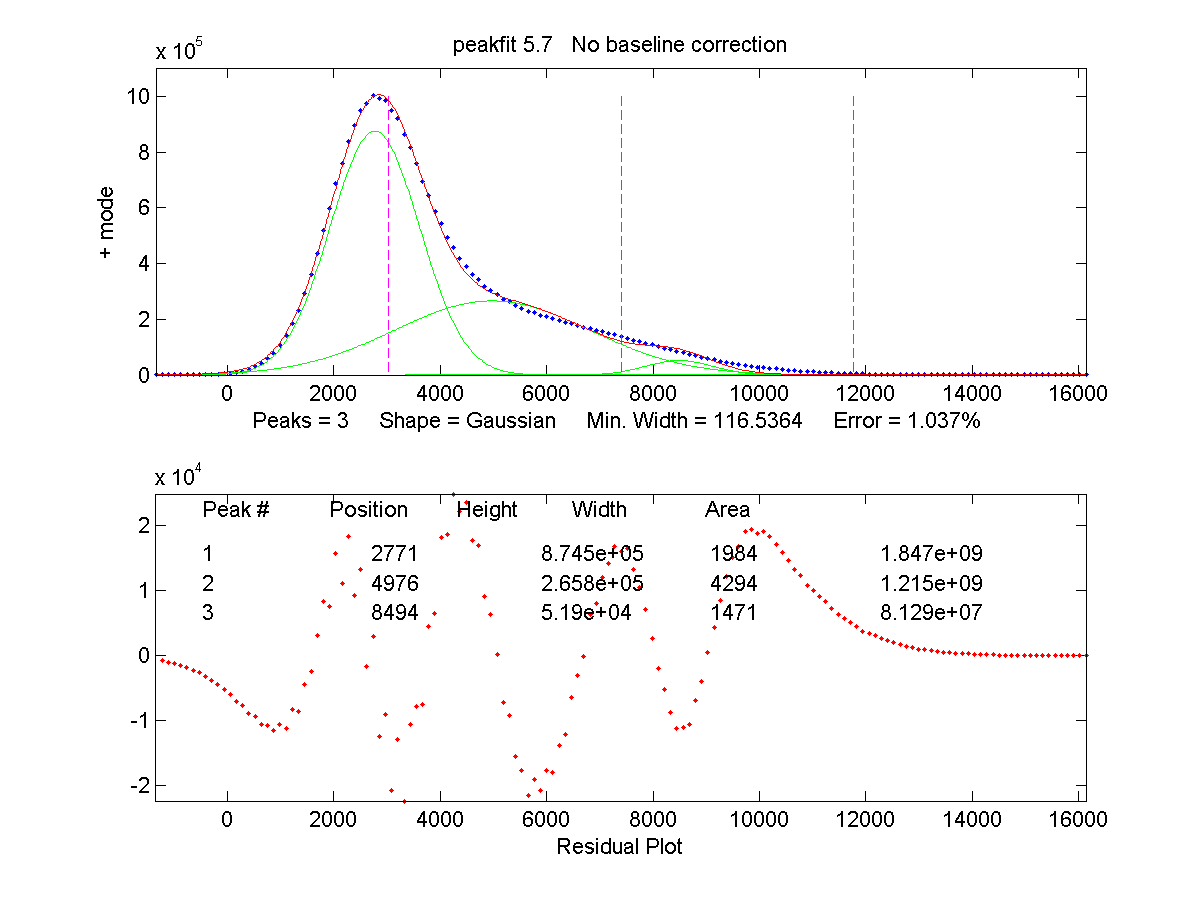
Peak fitting for Sample N
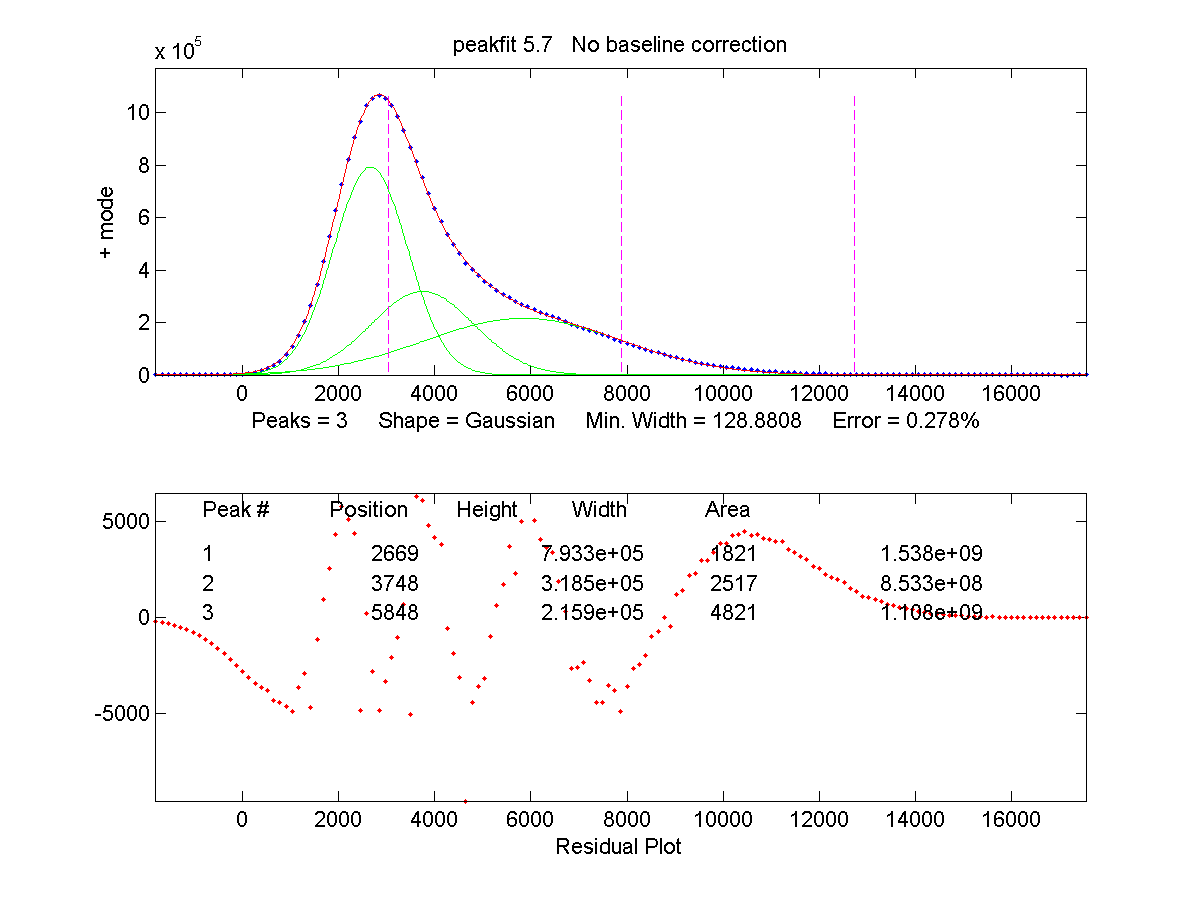
Peak fitting for Sample S
The difference between these two peak fits is significant. In the N sample, which is expected to have a lower volume fraction, there are two peaks that do not change very much from the two peak fit to the three peak fit. The third peak is very wide and with a much higher center. In contrast, the third peak on the S sample falls between the two peaks found in 2 peak fitting. The lack of a distictive 3rd peak might indicate that the N sample has a clearer distiction between the fiber and matrix for this sample.