Analytics on Working Specimen
To facilitate developing code for working on the 3-D image we chose to isolate a portion of the image for analysis.
The data chosen was in a 300 voxel cubed area.
Image Analytics
Analytics on the raw Image voxels.
| Field | Value (voxels) |
|---|---|
| min | -1858 |
| max | 17603 |
| mean | 3968.205313 |
| std | 1969.689071 |
| size | 301301300 |
Face Slices
These slices are the top faces in X-Y, Y-Z, and X-Z of the volumetric image.
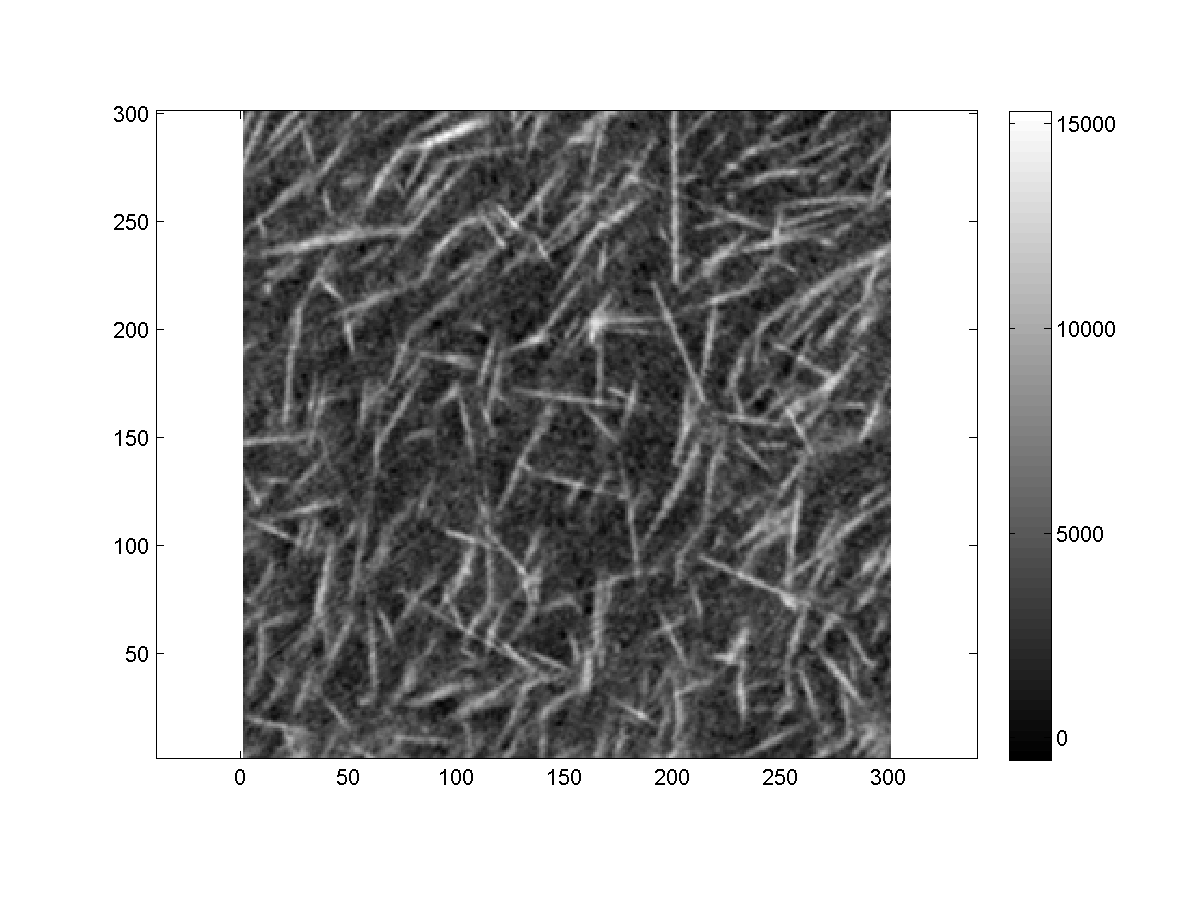
Top XY Slice of Sample Image
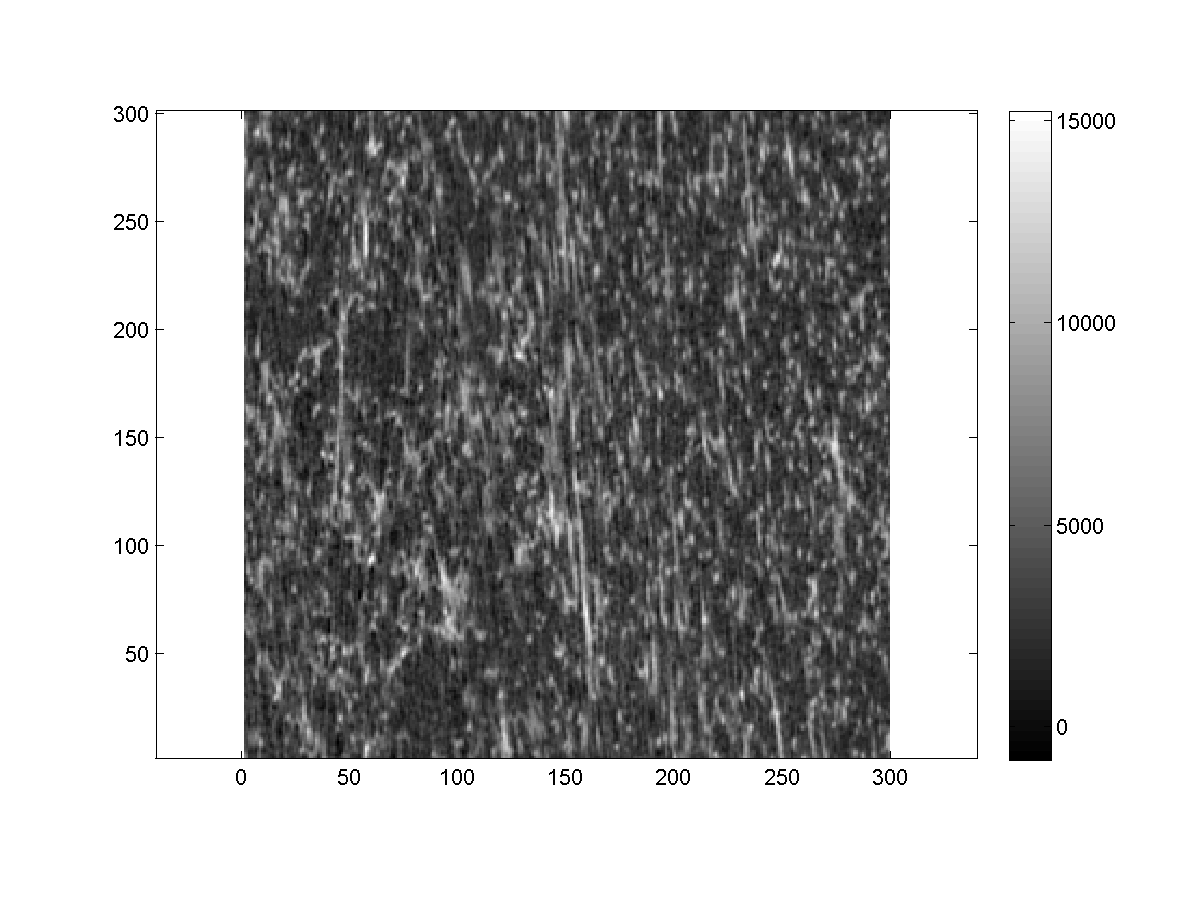
Top XZ Slice of Sample Image
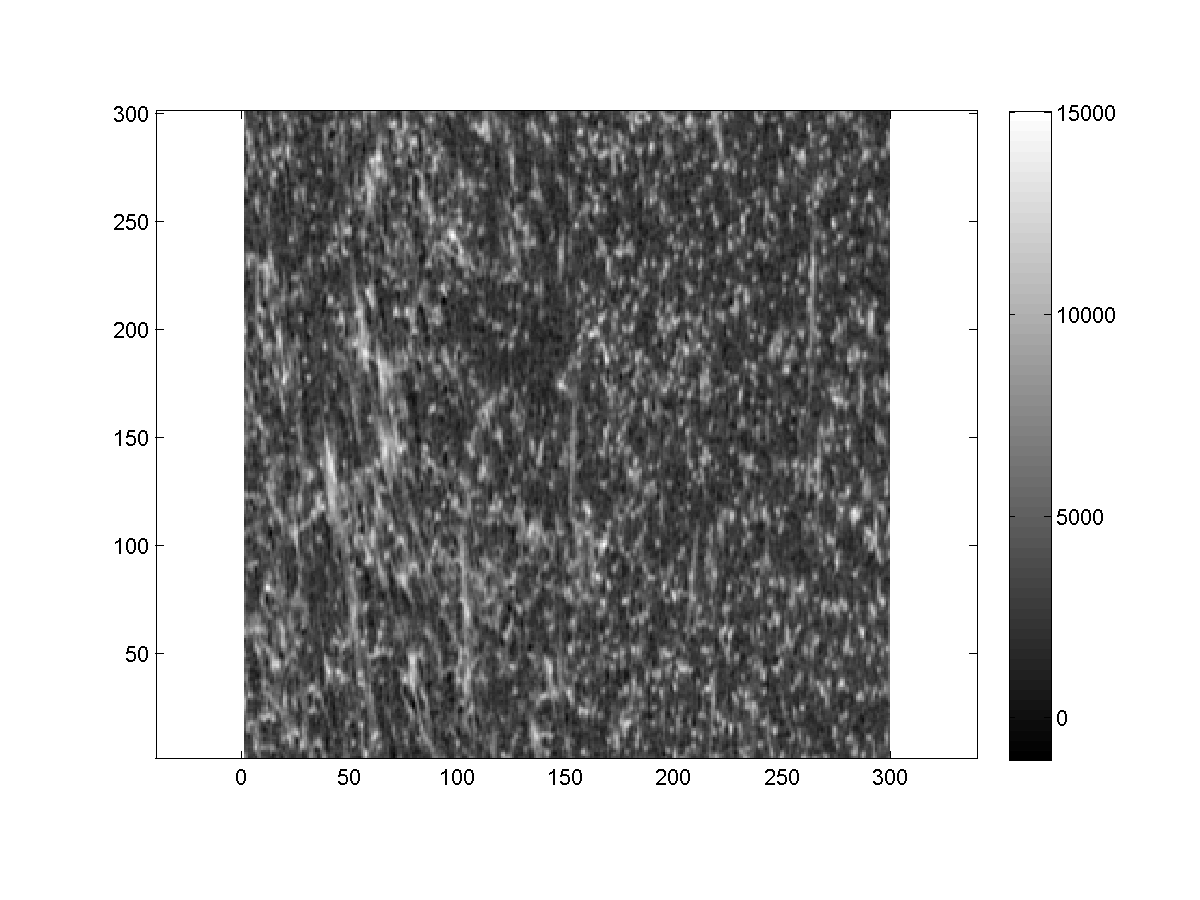
Top YZ Slice of Sample Image
Middle Slices
These slices are the top faces in X-Y, Y-Z, and X-Z of the volumetric image.
Middle XY Slice of Sample Image

Middle XZ Slice of Sample Image
Middle YZ Slice of Sample Image
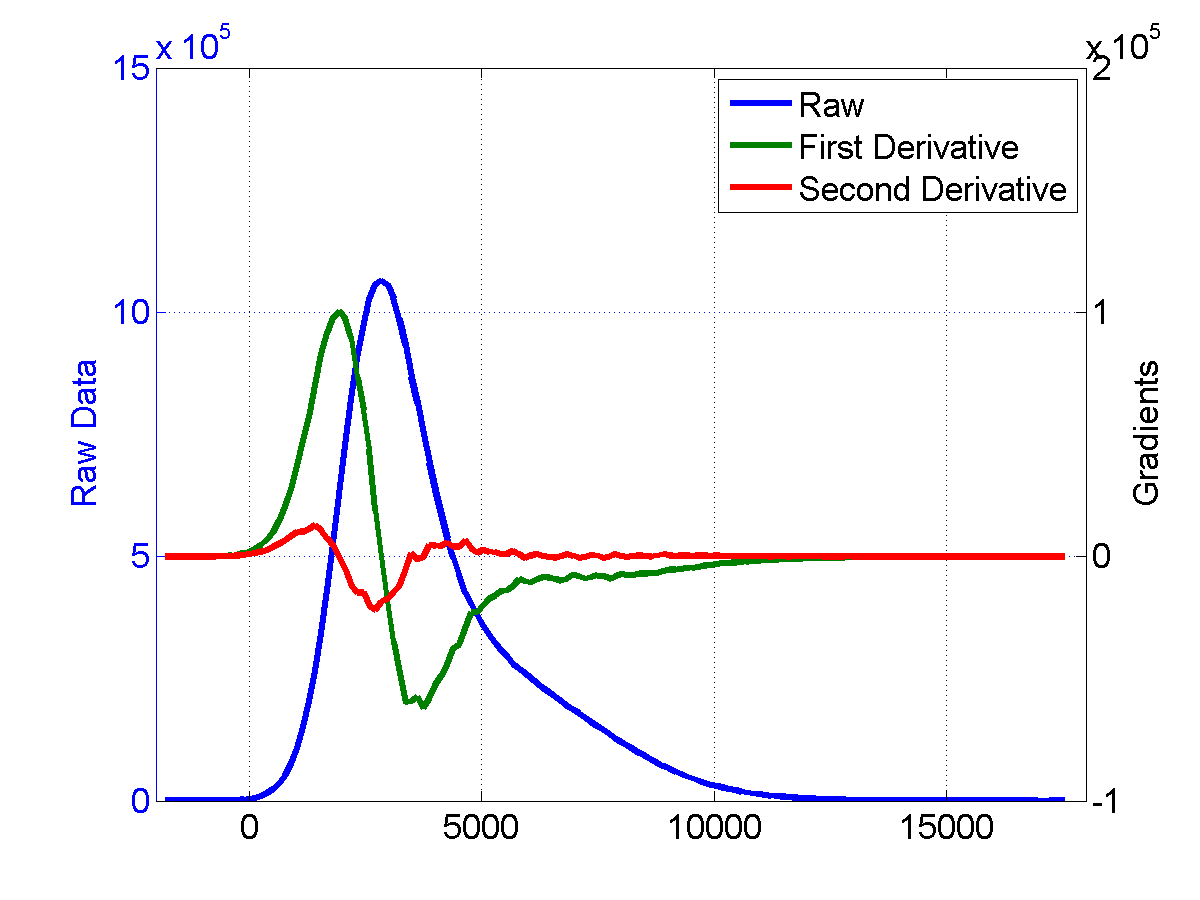
Distribution of Pixels Values
To better understand the range of our data, we created a histogram and combined it with the derivatives of our data. The histogram shows 2 or more convoluted peaks; consistent with the presence of two phases in our samples. This visualization highlighted a region after the 5000 value where the derivates are slowly converging to zero.
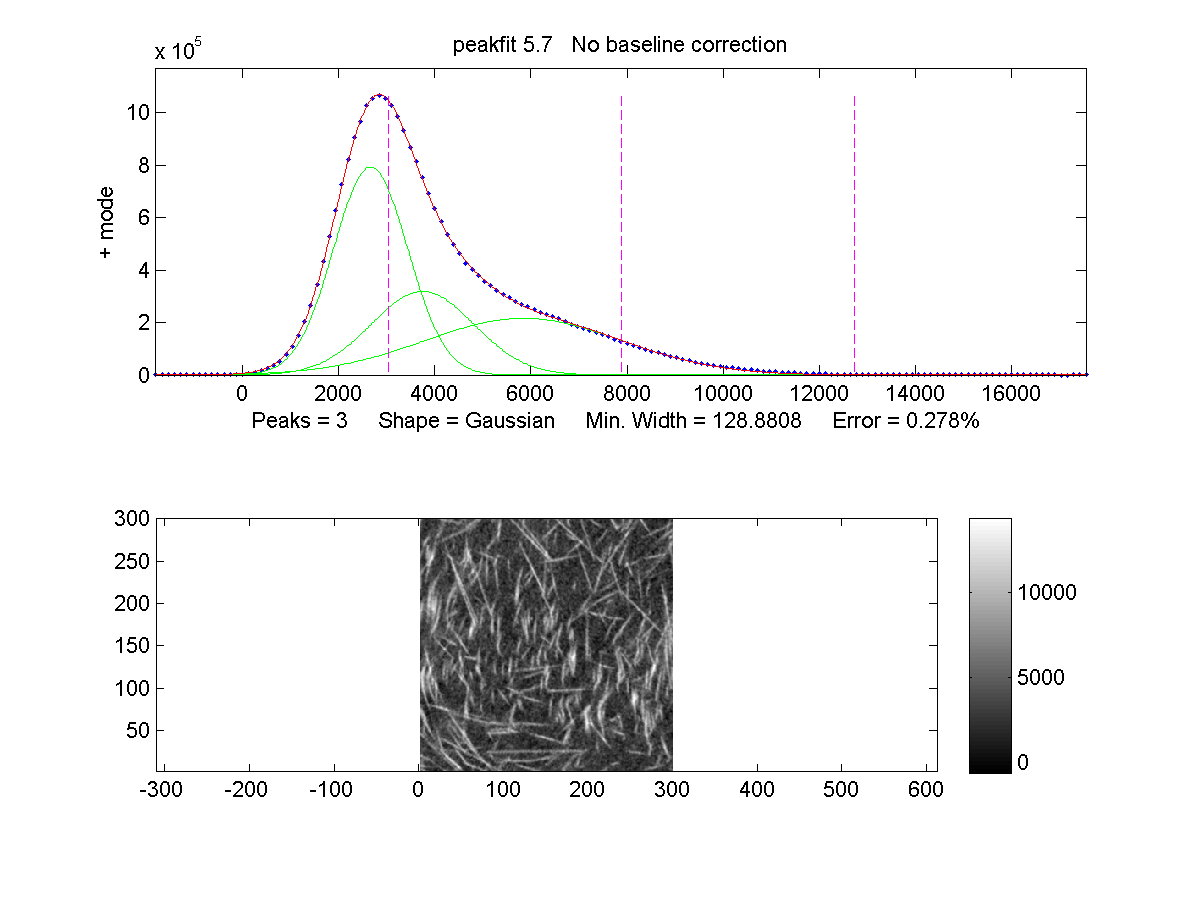
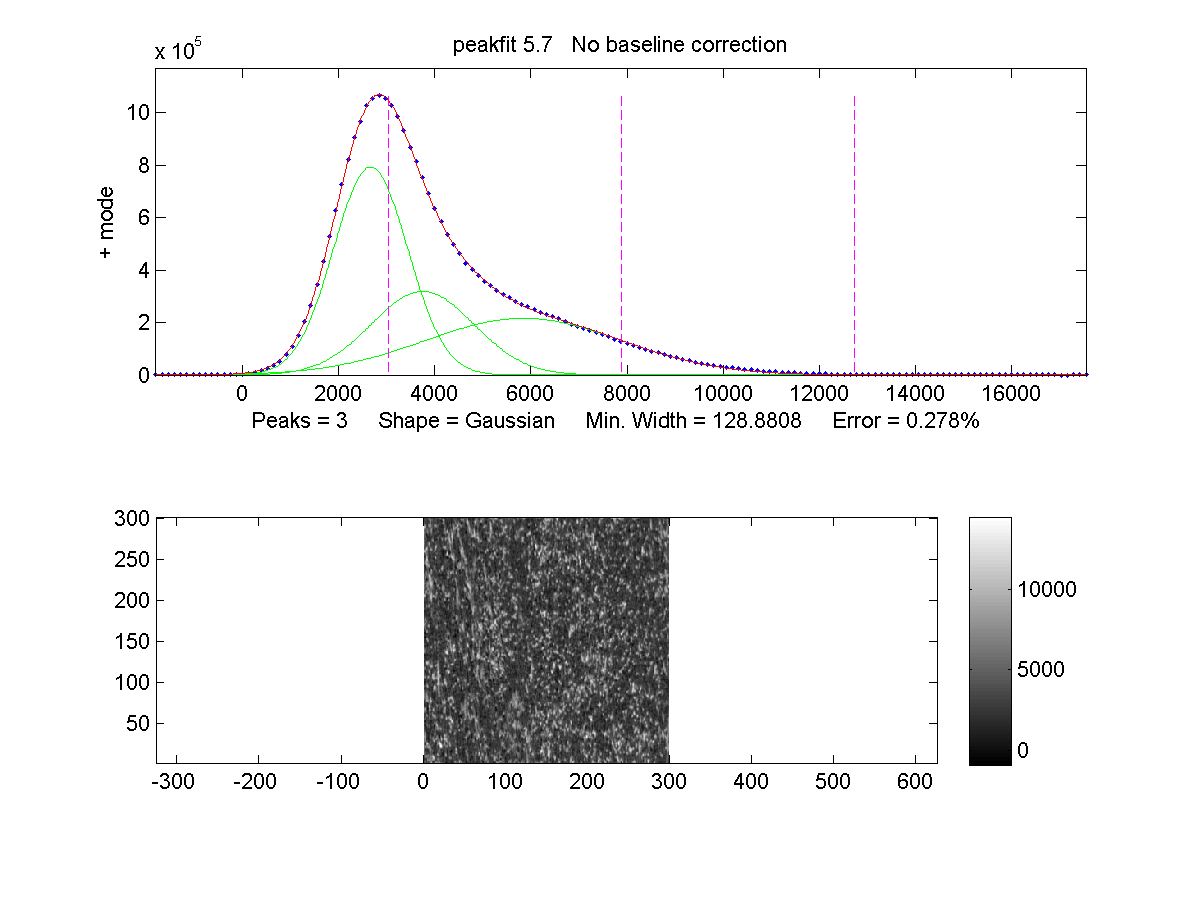
Test Peak Fitting on the Image’s Histogram
There should be at least two distinct peaks in the image histogram for this data, but the peaks are heavily convolved. We tried a peak fitting code from Matlab Central and produced the following output. The fit was significantly improved by adding a third Gaussian peak in addition to the two expected peaks. It is thought that this third signal represents the uncertain pixels due to the various sources of uncertainty in our measurement. It is perhaps helpful to note that the intersection of the second and third fit peaks occures at approximately the same location as the begining of the region of interest from the previous graph.
Challenges and Next Steps
- Many image analysis codes do not work well or at all on 3D datasets.
- Can anyone suggest good resources either in Matlab or another language such as Python?
From Tony for those who want to look at segmentation:
I think we need to use the peaks in the image histogram to better identify the phases. The Peaks of the matrix and fiber in the histogram are heavily convolved and can not be extracted naively.