DICOM Data Visualization
Structure-Property Linkage Development: Glass fiber reinforced composite
Current Work
Dicom images from previous post.
Visualization
3D Visualization of a single layer (first DICOM image)

3D Visualization of a single layer’s (first DICOM image’s) middle portion

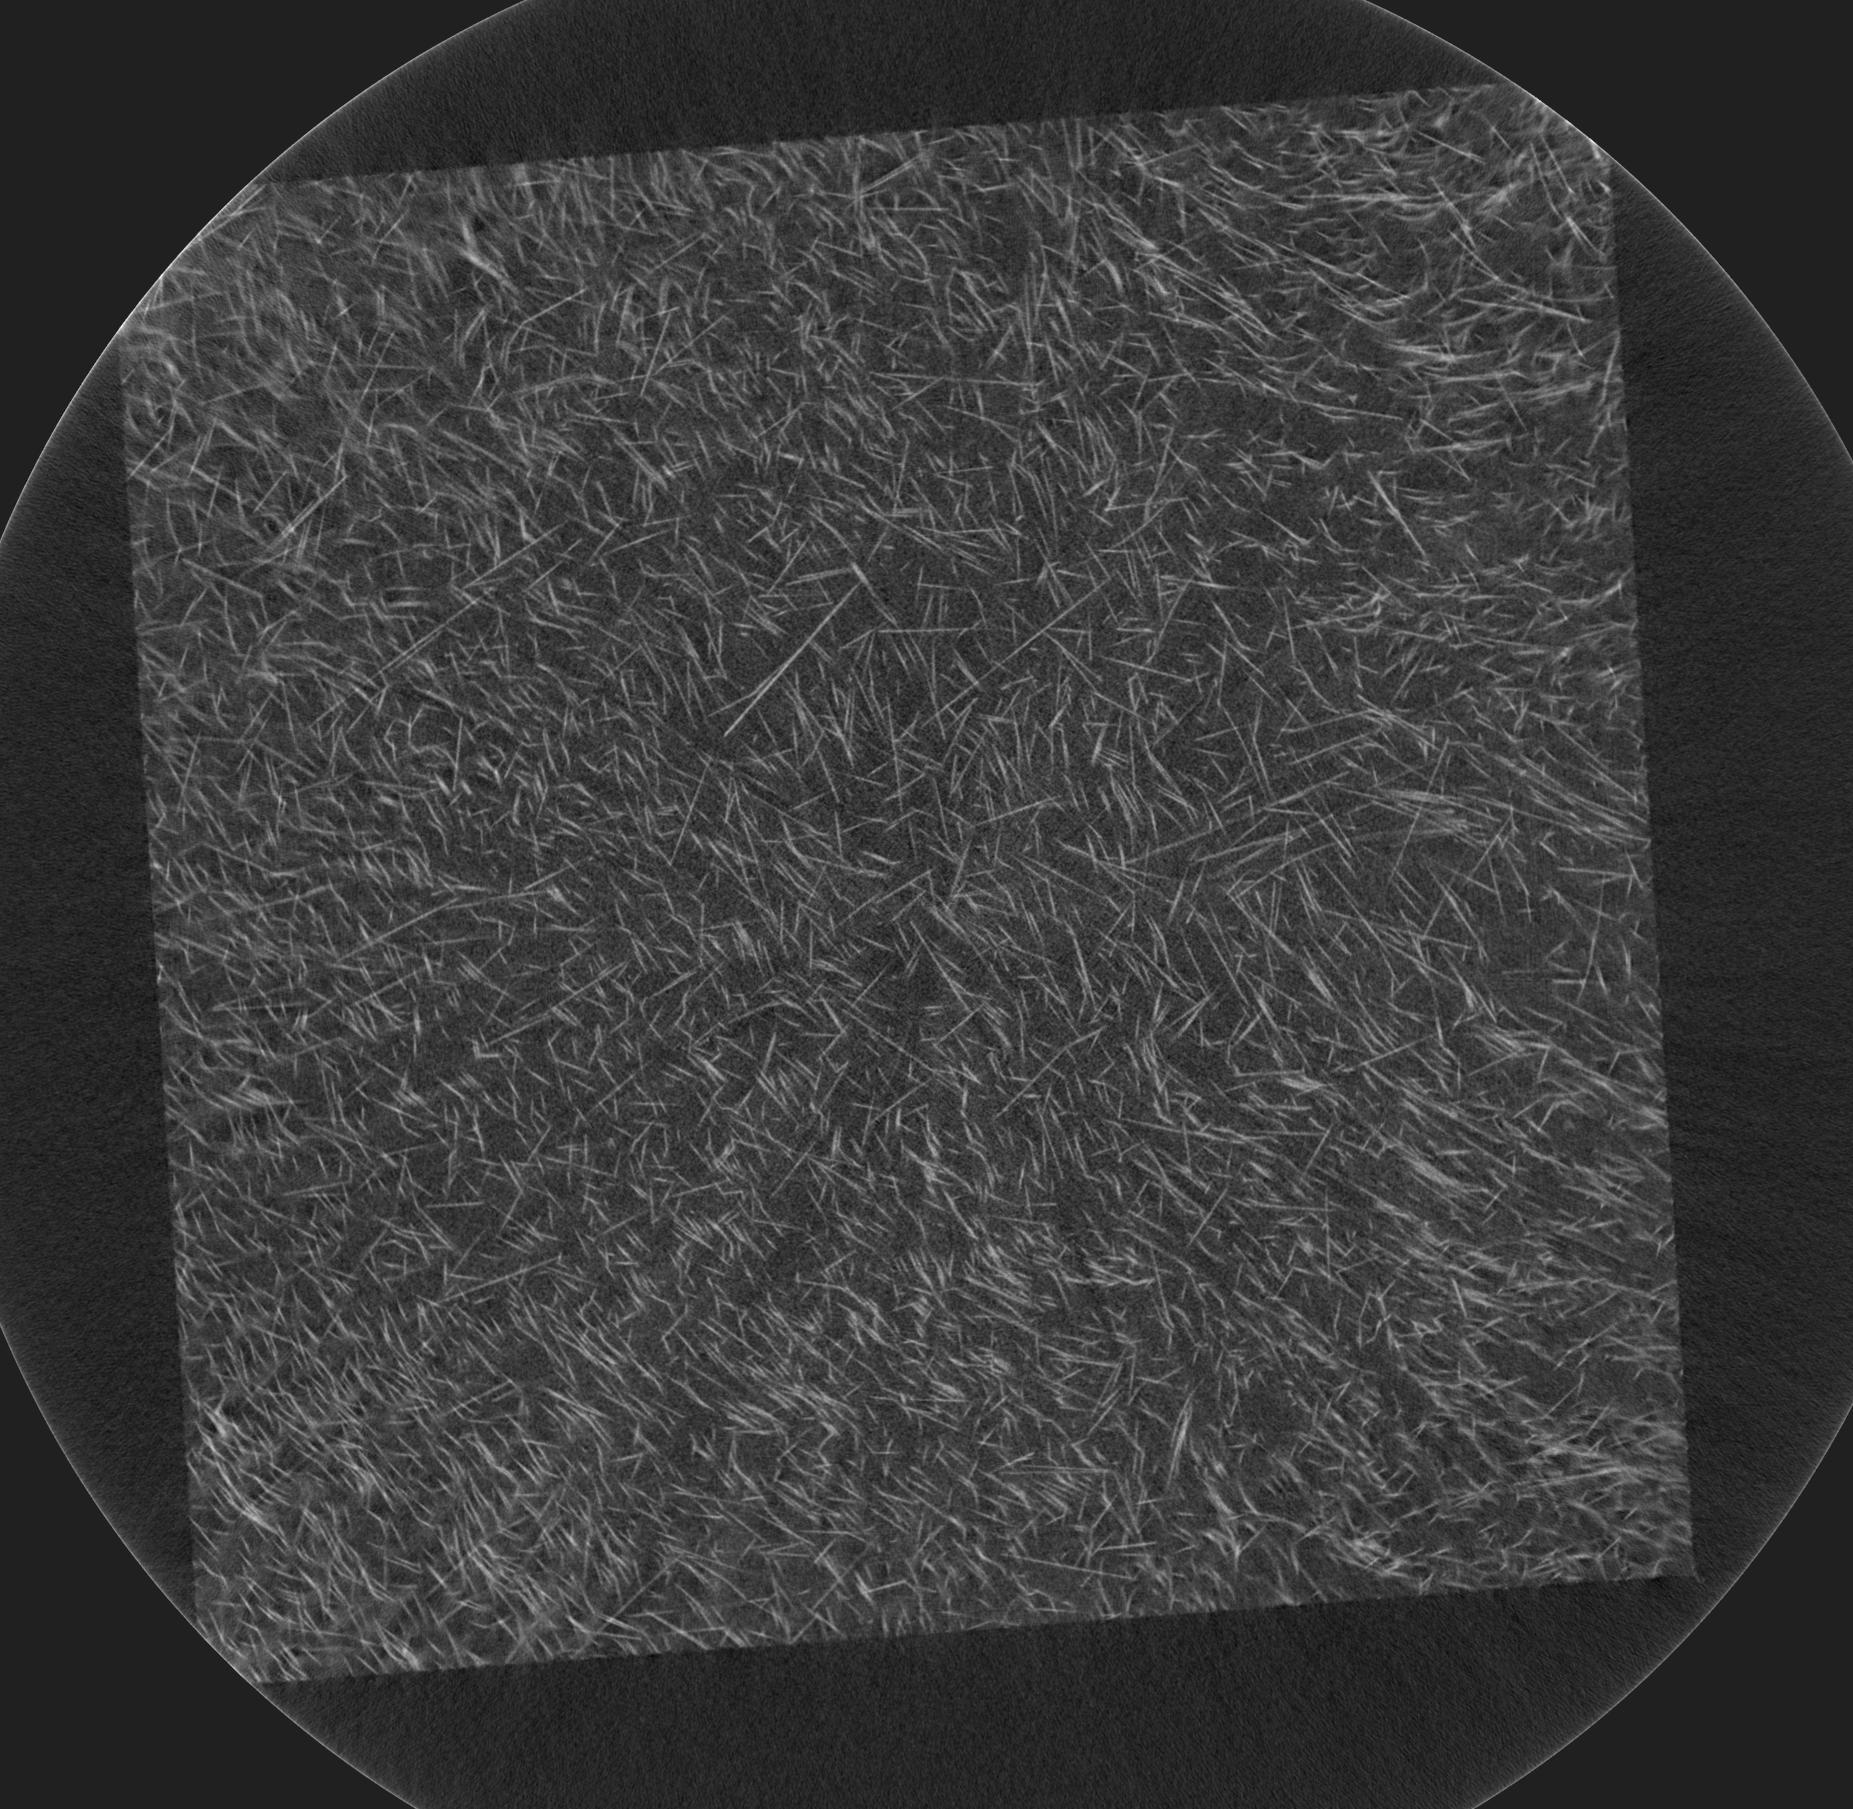
2D Visualization of a single layer (third DICOM image)

3D Visualization of 5 layers’ (first five DICOM images’) shortened middle portion

3D Visualization of 5 layers’ (first five DICOM images’) elongated middle portion

Cross-sectional Views


Thresholding
Thresholding was done to separate the pixels representing the fibers from the pixels representing the matrix.
To determine the value for thresholding the image, a threshold scan was done in each of the three planar directions (figure below).
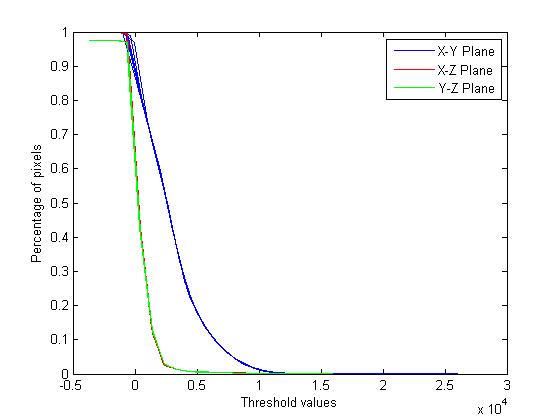
From this figure we can choose a thresholding value to apply to the images.
Code can be found at this Gist.
Problems
- Determine optimal boundaries for cropping to keep maximum possible experimental data
- Metric for determining if the thresholding is “good’
Next Steps
- Choose the number of states (h)
- Create a microstructure function
- Determine spacial statistics on sample